Claude Code Insights
A live stats page tracking how much I actually ship with Claude Code — hours, sessions, commits, and top projects, updated weekly from local JSONL transcripts.
The problem
I kept saying 'I use Claude Code a lot' without a number behind it. A PM claim without data is just vibes. I wanted a page I could point to that showed the actual volume — hours, sessions, commits, which projects took how much time — so the claim was checkable.
My hypothesis
Claude Code logs every session to JSONL transcripts on my local machine. If I wrote an aggregator that walked the transcripts, rolled them up by month, cross-referenced with my GitHub commit history, and rendered the result as a public page on schlacter.me, the whole thing could update weekly with one command.
What I built
A public stats page at schlacter.me/claude-code showing headline KPIs (hours, sessions, commits, days active), month-by-month breakdown, and top projects by time. Data comes from a local aggregator.py that parses ~/.claude/projects/ JSONL transcripts + git log. A render_social_image.py script generates a 1200x1200 PNG for LinkedIn. The whole workflow runs from one natural-language prompt to Claude Code — the prompt is copy-pasteable on the page.
What broke
Session duration is estimated from timestamps — idle time between tool calls inflates hours. I was explicit about the methodology. The public GitHub commit count misses private repos, which is most of my work; I linked the GitHub profile so readers can see for themselves.
What I learned
Making your own usage data public changes how you use the product. Once the number is on a page, you notice when it drops. The page isn't just a portfolio artifact — it's a feedback loop on my own habits.
If I kept going
Automate the weekly refresh via scheduled task instead of manual prompt. Add a private/public commit split so the count is less misleading. Chart the hours-per-week trend as a sparkline at the top — the shape tells the story better than a table.
Prototype
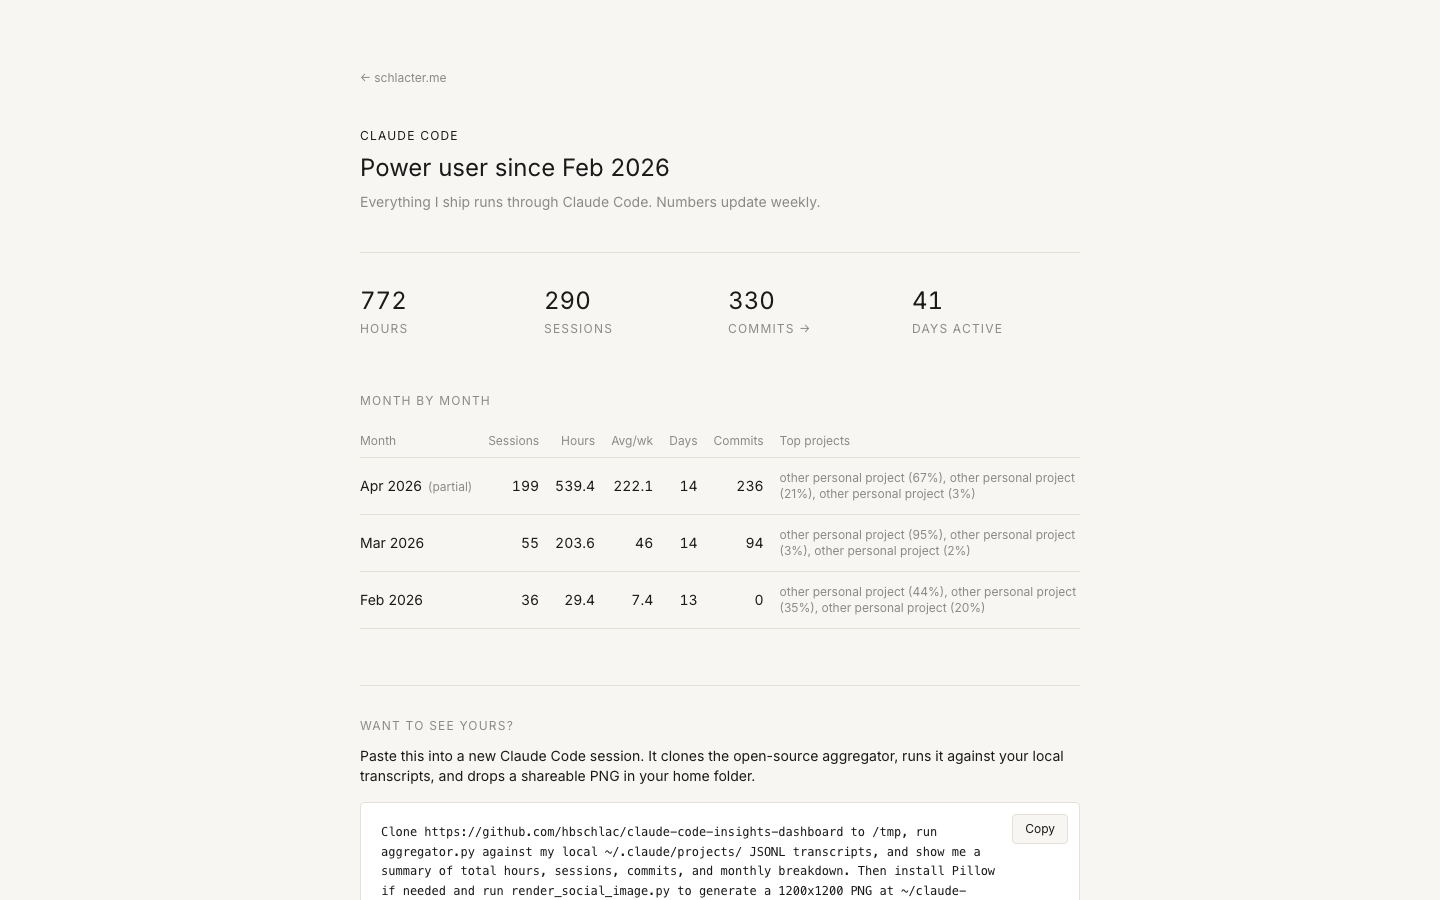
Stats page hero: hours, sessions, commits, days active — updated weekly.
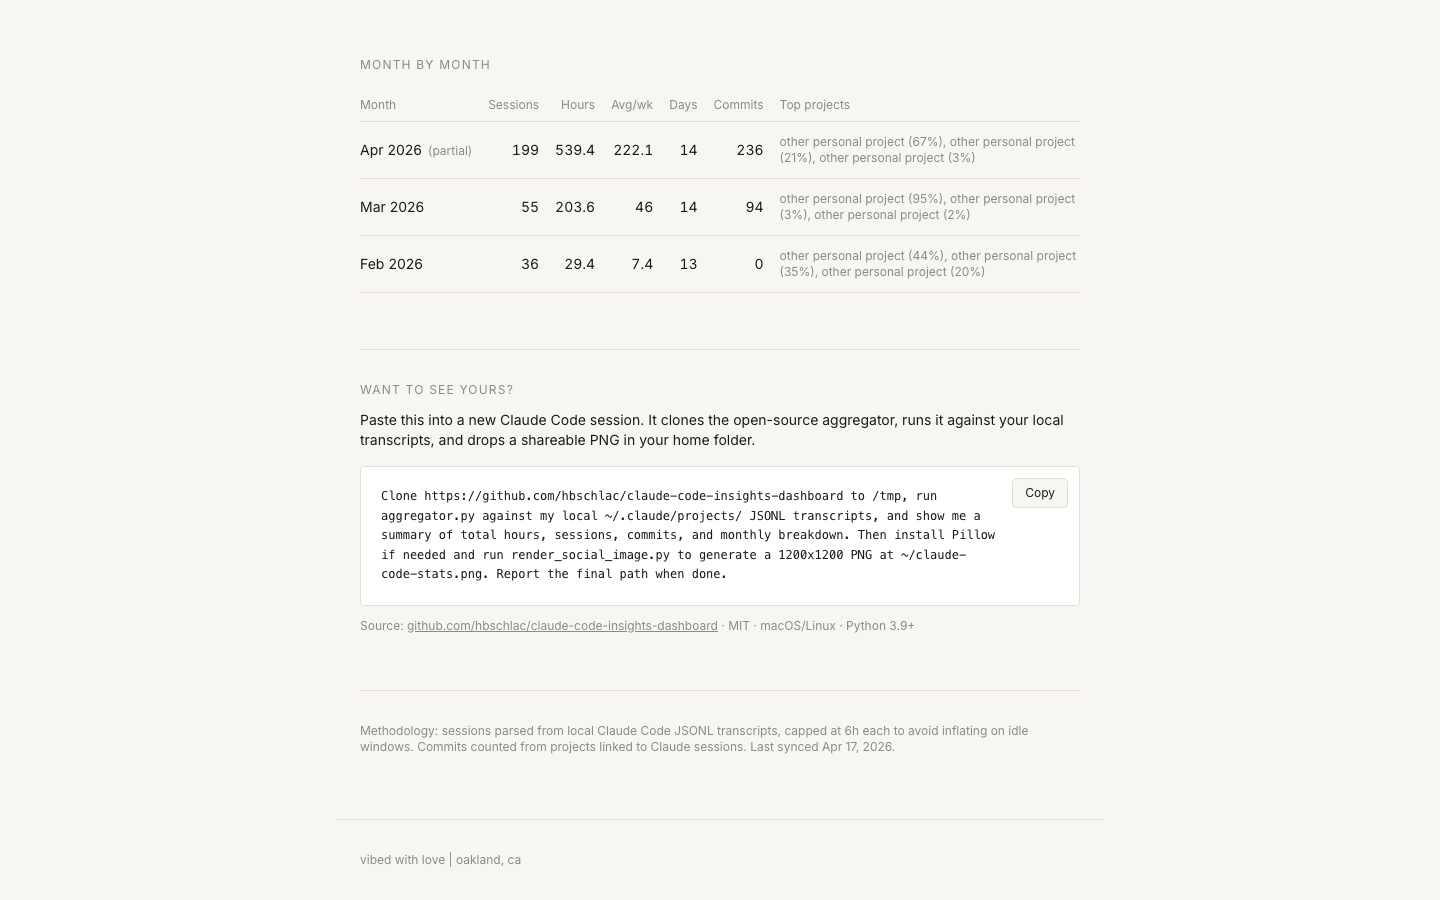
Month-by-month breakdown with top projects per month.
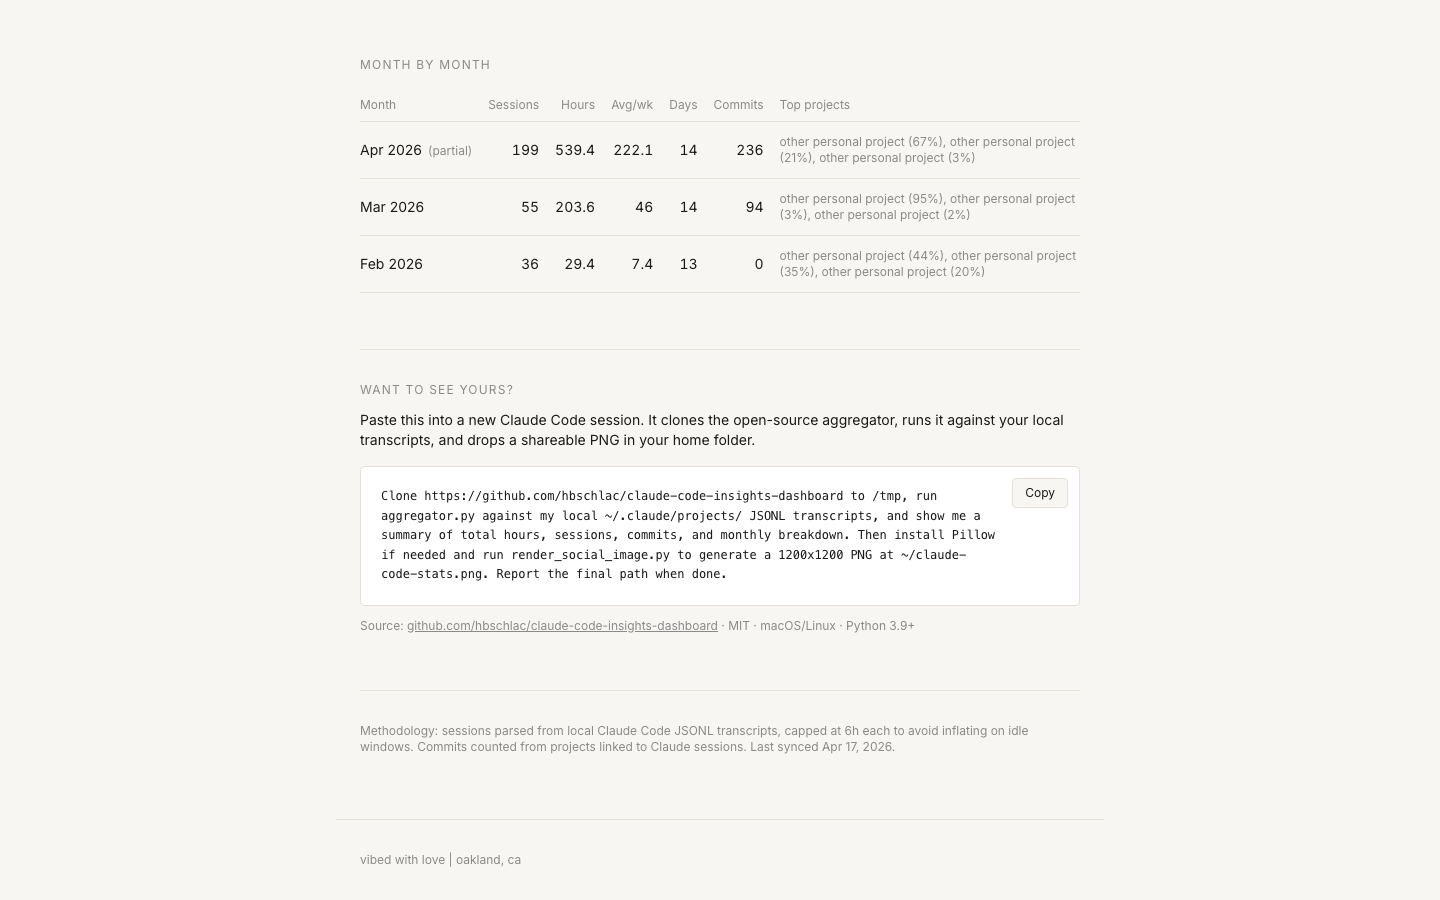
The copy-pasteable prompt that regenerates the whole thing.